
PharmaRank is a pilot project created by DELab UW in cooperation with PZPPF, which enables economic rankings for companies in the pharmaceutical sector.
The PharmaRank tool allows comparing Polish pharmaceutical manufacturers according to their importance to the national economy through the use of a ranking algorithm.
FUNCTIONS OF PHARMARANK
PharmaRank operates as an interactive application that allows:
- running real-time simulations for various indicators
- adjusting weight values for particular indicators
- making flexible comparisons between individual companies
PharmaRank has features that allow to:
- generating tables based on selected criteria and user-defined sorting – e.g. comparison of top companies according to their importance to the Polish labor market, or generating tables showing companies most similar in terms of net export
- classification of pharmaceutical companies according to adopted indicators – the result is division of companies into five segments (A‑E) according to the proposal put forward by the government administration
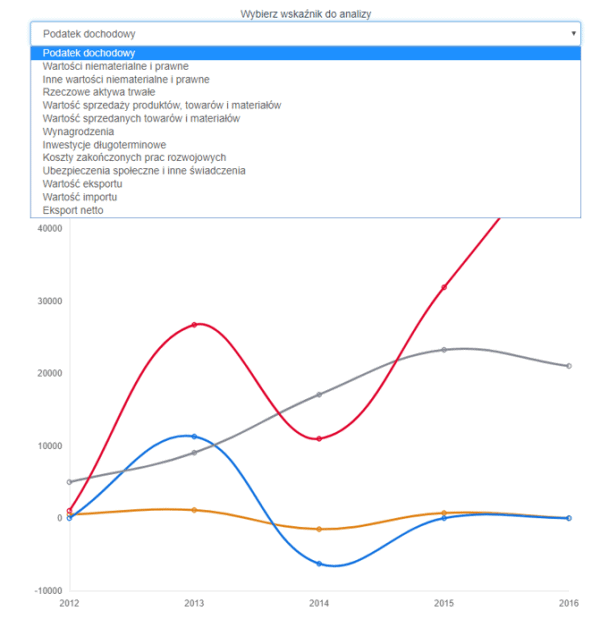
- creation of interactive charts of changes over time of particular indicators
- initial visualization of the algorithm dividing companies into segments
CATEGORIES IN PHARMARANK
The categories were selected based on DELab UW macroeconomic analyses of the impact of the pharmaceutical sector on the economy. In addition, the results of the study were juxtaposed with a microeconomic analysis of companies belonging to the sector. The selection of categories was based on the study of the impact of the pharmaceutical sector on the economy.
The selection of impact categories is subject to change and depends on the availability of the firm-level data itself. The application allows to enter a broader or different set of categories. This changes both the ranking results and the assignment of companies to categories (A through E). By default, the tool considers five impact categories (sales, investment, taxes, wages, net exports).
To meet the criterion of basic comparability, the data are derived primarily from corporate balance sheets. Their source is the combined databases of business intelligence firms Biznode and InfoCredit. In the case of missing data, PZPPF member firms had the opportunity to complete the database to improve comparability across categories. The data update process can continue as needed.
-
Category selection additionally meets the following conditions:
- simple definition – the category should be simple and quantifiable by companies for purposes such as avoid additional transaction costs,
- understandability – the category should be understandable to both businesses and public administration,
- auditability – the category should be easily verifiable.
METHODOLOGY FOR SELECTING CATEGORIES AND WEIGHTS
ADJUSTING WEIGHTS FOR SELECTED CATEGORIES
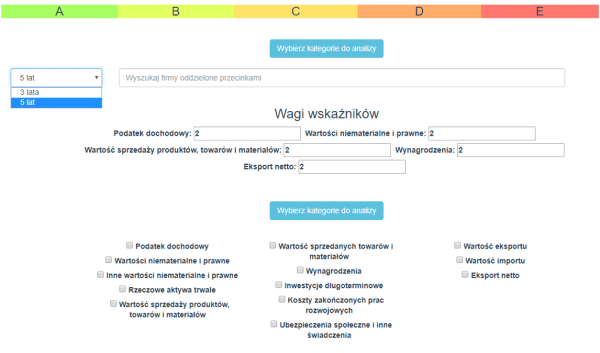
A broader set of categories is available in the app, which can be selected using the „Select categories for analysis” button.
For example: if we assign weights e.g. 1, 2, 1, 3, 4 then the result will indicate the relative importance of each category. The second category is twice as important as the first, and the fourth is 3 times as important as the first, while the first and third are equally important.
The results are normalized by relating the values found in each firm to the maximum value in the sector and rooting, with negative values (or no data) changing to zero.
The basic indicator takes the value for each category from 0 to 100%. If the maximum value in a given category is 10 thousand and the score of the company of interest is 2.5 thousand, we get a score of 50% (the root of 2.5 thousand divided by the root of 10 thousand).
HOW DO WE GET THE END RESULT?
To get the final result, the values of each category are multiplied by the weight for that indicator and then divided by the sum of the indicator weights (in our example: 11). As a result, the maximum score can be 100%.
The classification of companies is based on a formula:
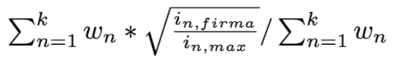
where: w_n: weight of the n‑th indicator, k – number of indicators, i_n – indicator value of the n‑th company, i_n max – maximum indicator value achieved in the sector (in all years).
Assignment to the category is based on the weights entered by the user – by default it is a minimum of 40% for category A, 20% for B, 10% for C, 5% for D. Companies below 5% receive category E. In the application you can select data for the years 2012–2016, as well as – in a separate tab – the 5‑year and 3‑year (2014–2016) average for individual companies.
METHODOLOGY FOR SELECTING CATEGORIES AND WEIGHTS
Macroeconomic background
Considering direct, indirect and revenue effects together, the pharmaceutical sector contributed in 2013 in Poland to the generation of GDP worth more than PLN 15 billion (c. 1% of GDP), maintenance of more than 100 thousand jobs (with direct employment of 22 thousand people) and provision of budget revenues of c. PLN 2.4 billion. The pharmaceuticals sector also has a significant impact on the innovativeness of the Polish economy, generating 7% of total R&D spending.
Impact of the pharmaceutical sector on GDP
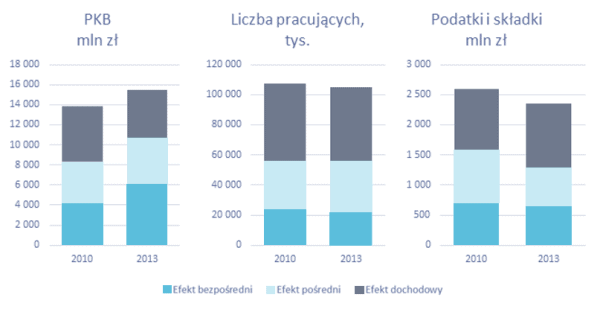
Source: Own analysis based on data from PZPPF and business intelligence agencies: Bisnode and Infocredit.
The pharmaceutical sector, compared to the Polish economy, is characterized by high spending on R&D activities. Total intangible assets and property, plant and equipment increased in all periods analyzed. By amount, R&D and capital expenditures are dominated by large companies. As a percentage of revenue, large companies with Polish capital stand out, as they also increased the value of tangible and intangible assets the most.
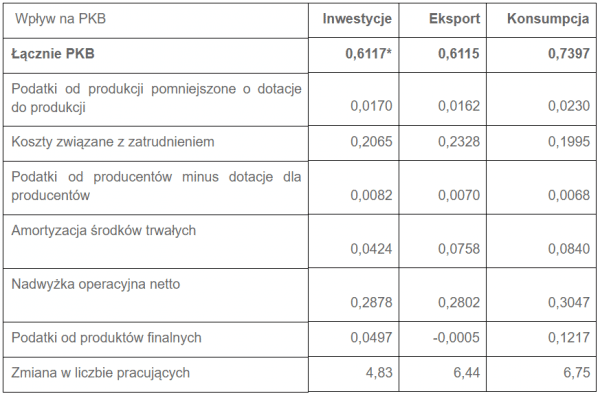
The sector affects GDP through investment, exports and consumption. The magnitude of this response is shown in the table.
Interpretation: An increase in investment expenditures (total at purchaser’s prices) by 1 PLN will increase GDP by 0.6117 PLN. Of which, product taxes will increase by 0.017, labor costs will increase by 0.2065, etc. An increase in capital expenditures by PLN 1 million will result in an increase in the number of employees by 4.83 persons.
Macroeconomic multipliers – columns present the impulse (with an increase by 1 PLN), rows – the value of the response of individual categories
Key channels of influence
Assessing economic impact at the firm level requires a different methodology than that used by the macroeconomic approach. Using current equity company reporting, it is possible to more accurately analyze only direct effects, as the study of indirect and income effects is feasible within a network analysis of the entire economic ecosystem.
For the purpose of PharmaRank, pro-growth categories were selected: export, investment, sales (simulated by consumer spending). In addition, related output categories of employment costs and business taxes are included.
SALES
The simplest method of measuring an entity’s contribution to GDP based on financial statement data is sales volume. It is worth noting that the pharmaceutical sector in Poland is significantly dominated by the largest players. Man can also look at this channel of influence more broadly. What is often emphasized is the importance not of the sheer size of GDP for a country, but of the rate of its growth. In many cases, it is not the wealth of the economy that determines macroeconomic stability, but precisely changes in the volume of output. Therefore, alternatively, the dynamics of change in business sales volume was used as a financial indicator to describe the impact on the national economy.
In the case of sales of goods and materials, the multiplier relative to final demand for domestic goods derived from an input-output model of the Polish economy was taken as the reference value of the multiplier.
Average annual sales from 2014 to 2016
NET EXPORTS
Companies generating the largest trade surpluses and deficits (2014–2016 average, thousands)
Net exports is one of the major components of GDP (in addition to consumption, government spending, and investment). A characteristic of the pharmaceutical sector is that it is highly import-intensive and generates a trade deficit.
The Strategy for Responsible Development (SOR) points to foreign expansion as one of the main strategic areas. Capturing this area is possible by measuring export sales revenue.
At the same time, SOR emphasizes the need to support enterprises that create high added value. In order to account for the value added created in the economy, it is necessary to include the value of imported purchases as deducting the value of domestic production. It is also possible to expand the indicator to separately track imports of raw materials, materials, semi-finished goods and imports of goods to more accurately track value added.
This also allows for better consideration of the sector’s impact on GDP, of which net exports (the value of exports minus the value of imports for the entire economy) is a component.
TAXES
Companies of the pharmaceuticals sector report PLN 244 million in income tax annually. It is worth noting that companies with Polish capital have significantly increased their contribution to the tax base over the analysed years.
We consider the contribution of pharmaceutical companies to the tax base on the basis of CIT. PIT paid by companies on behalf of employees also contributes to the tax base, however, due to its collinearity with the wage bill, its inclusion would result in double bonus for companies for the number of employees.
Measuring the amount of reported corporate income tax allows taking into account the specificity of companies from special economic zones. By setting appropriate weights for CIT and investment-related indicators, it will be possible to take into account the efficiency of the applied tax incentive policies.
Companies generating the largest trade surpluses and deficits (2014–2016 average, thousands)
Average annual income tax paid by pharmaceutical companies (2014–2016)
SALARIES
Average annual salary cost (2014–2016)
Companies generating the largest trade surpluses and deficits (2014–2016 average, thousands)
The best measure of the direct impact of a company’s activities on the economy through the employment channel is the level of payroll-related costs. Unfortunately, the Accounting Act (AoR) allows the profit and loss account to be prepared in two variants: calculation and comparative. Only the comparative variant distinguishes wages and salaries, social security and other benefits in operating expenses.
The pharmaceutical sector employs, on average, more highly qualified and better paid employees. In addition, it supports the creation and development of human and social capital, an area that affects the achievement of SOR goals.
In order to promote investment in human capital more strongly, it is possible to extract an indicator limited to employees with higher education or at least a PhD degree.
The inclusion of social security contributions additionally rewards companies that do not use so-called „junk contracts” in their operations (an additional variable to be selected in PharmaRank).
Selection of weights
Guided by these principles, the following categories were assigned to the primary channels of influence:
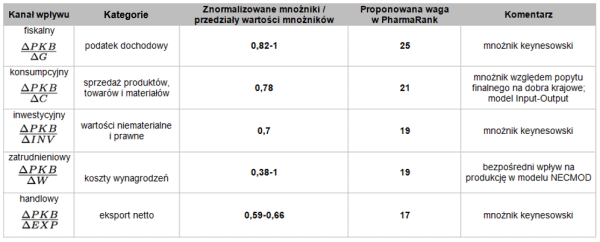
The methodology for assigning weights was derived from the DELab UW study (2017). The weight values are derived from normalizing the multipliers of each influence channel. Normalized value ranges were determined for the influence channels. The category weight is the proportion of the sum of the compartment means of each multiplier multiplied by 100. The impact channel analysis was based on:
- NBP NECMOD model: a macro-econometric model, a multi-equation model reflecting the structure of the Polish economy and its links with the world economy,
- and macroeconomic studies of the National Bank of Poland (NBP; see recommendation sources).
What’s next?
The ranking provides the flexibility to include additional categories. Including the value of chemical and biochemical production, taking into account the direct sales value of drugs complying with the Polish origin rules (data currently unavailable) and excluding from the ranking companies whose import-to-sales value exceeds 35% would allow a more accurate assessment of the actual importance of a given pharmaceutical company for the Polish economy.
If the government administration is interested in the PharmaRank application, it will be possible to develop it further and map the real impact of individual companies on the Polish economy even more accurately.
However, this will require that all pharmaceutical companies are subject to reporting obligations. Indicators for a more detailed analysis of the macroeconomic impact of individual pharmaceutical companies are described in detail in a presentation by DELab UW (2017).
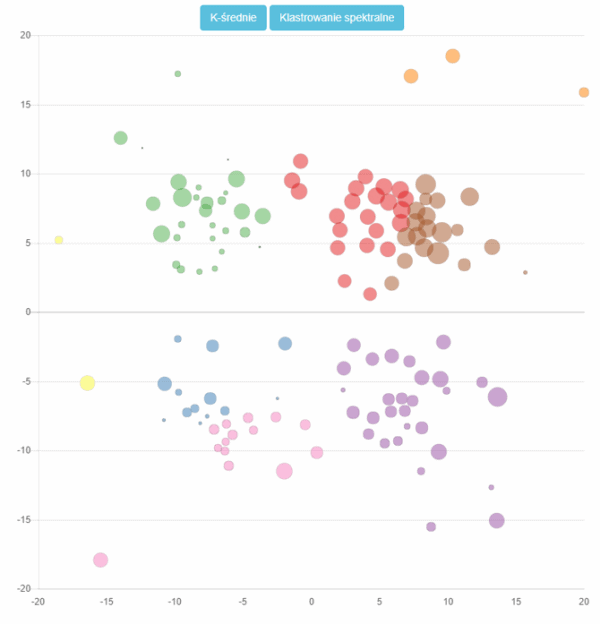
Basing the analysis on more detailed data will allow the use of more advanced parameterization methods. Machine Learning techniques (clustering algorithms) will be used to find similar companies and assign them to particular segments.
SOURCES OF RECOMMENDATIONS
DELab UW (2015). Makroekonomiczne aspekty znaczenia sektora farmaceutycznego dla polskiej gospodarki.
DELab UW (2017). Koncepcja pomiaru znaczenia firm farmaceutycznych w polskiej gospodarce.
NBP (2009). The new macroeconometric model of the Polish economy. Working Paper, 62.
NBP (2010a). Reestymacja kwartalnego modelu gospodarki polskiej NECMOD.
NBP (2010b). Mnożnik wydatków państwowych i szacunki jego wielkości dla Polski. „Materiały i Studia”, 246.
NBP (2012a). Reestymacja kwartalnego modelu gospodarki polskiej NECMOD.
NBP (2012b). Fiscal multipliers and factors of growth in Poland and the Czech Republic in 2009. Working Paper, 117.
NBP (2015). Mnożniki skalne w modelu z ograniczeniami kredytowymi. „Materiały i studia”, 318.