


The pandemic and its associated restrictions have affected the entire world, changing the way people work and live. Much has already been said about the impact on labor markets, job displacement to the home, and the social impact of the pandemic. However, little is known about actual changes in everyday behavior and how these changes relate to the severity of the crisis, enforced constraints, or level of development.
In his presentation, Dr. Wojciech Hardy provides the first evidence of changing daily life patterns, which includes information on the entire period since the beginning of the pandemic for more than 50 countries. He uses information about when people listen to music to trace how the pandemic disrupted typical patterns. The data collected by the team comes from weekly YouTube charts and is combined with Google Trends data. This allows you to observe the hours of peak music listening in different countries and times. This data is combined (work in progress) with case information, constraints and blockers, and macro indicators, as well as other available Google data for validation.
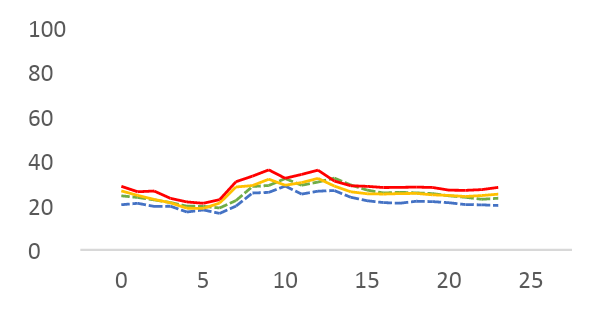
Based on the results of the analysis, there is a clear change in listening patterns with the onset of the pandemic. The pandemic has reduced much of the music consumption during hours typically spent commuting to and from work. On the other hand, late evening consumption increased after usual time, suggesting a possible shift to late evening hours. These in turn are offset by starting the workday later. These shifts are characteristic only of weekdays, confirming a connection to school or work.
Methods and data
First, the teat have collected the weekly top 100 YouTube artists charts for the 57 available countries. The data so far was collected for the period of January 2020 to January 2021 and will be continuously extended to cover both further periods (including 2021) and earlier periods (2019 for a benchmark). The chart data includes the number of views in a given week for each of the top artists.
Second, for each week of the data, they have queried Google Trends for YouTube for the search popularity of the respective artists with an hourly frequency. Thus, for each week and each country, 100 artists were checked for popularity in the YouTube searches, with the queries returning the popularity with an hourly frequency for all seven days of the week. The combined dataset of Google Trends and YouTube charts allows us to track both the change in the hourly patterns of music listening and the change in total viewership.
The few selected figures below show monthly averages for the estimated patterns of music listening in several countries. Of note are the shifts in workday patterns and lack of such shifts in the weekends. Moreover, Sweden – which did not enforce any restrictions at the start of the pandemic – does not reflect pronounced shifts. This is in line with the causal interpretation of the pandemic and restriction effects on the observed patterns.
| Workdays | Weekends |
| Australia | |
 |  |
| Germany | |
 |  |
| Poland | |
 |  |
| Sweden | |
 |  |
| USA | |
 |  |